


Are any public, regional universities growing?
Defining terms and what qualifies as an "answer"

The decline in American undergraduate enrollment is a theme in my writing. That’s because it’s a persistent undertone, audible underneath nearly every conversation regarding the present and future of higher education. Almost everyone talking about higher ed ends up talking about enrollment questions whether they like it or not.
But declining enrollment does not happen at even rates across institutions. Yale and Dartmouth will not struggle to fill their seats. Michigan and Texas will keep the lights on just fine.
The less prestigious or well known an institution is, the more risk it faces. This is true of several kinds of colleges, but today I’d like to focus on the public, regional university. There are plenty of examples of articles prophesying their imminent doom. I wanted to see how valid that consensus was.
Defining the “regional university”
The basic division of public vs. private describes whether an institution is (partially) state-supported and, thus, accountable to more state oversight. But what makes a public university “regional”?
“Regional” contrasts with “national.” The terms are used by the US News ranking system, but they are an adaptation of terms from the Carnegie Classification System. This independent body assesses, among other things, the “research activity” of universities. Those which offer a sufficient number of research doctorates are then coded as either “R1- very high research activity” or “R2- high research activity.”
We can move past the grade inflation here; “medium research activity” is apparently impossible. US News takes these odd terms and simplifies them such that R1 institutions are “national universities,” while R2s are “regional universities.”
Perhaps this means that R1s have more name recognition across the country, while R2s do not. You can find plenty of exceptions to that. But whatever the term means, it establishes a hierarchy.
US News ranks every kind of college on other tiers as well. But the “regional” moniker gets popularly applied to colleges whether they’re ranked as “regional universities” according to US News or not.
Often, “regional” is simply used as a contrast to “flagship.”
The idea of the “flagship” university is that it’s the leading university of a state, its pride and joy, its standard setter. Ostensibly, each state has one. Often, it’s whichever institution is more “liberal arts” oriented, is older, and/or is typically not its land-grant institution.
But that puts you in awkward territory. Here in Indiana, Indiana University is usually described as the flagship, if you have to pick one. But since “flagship” is used as a contrast to “regional,” that would mean Purdue University is regional. No self-respecting Boilermaker would accept being anything less than IU’s peer. So, instead, many states have multiple “flagships,” at least in practice. Think Iowa/Iowa State, Virginia/Virginia Tech, Texas/Texas A&M.
What all those institutions have in common is that they’re all R1s.
But when we talk about the regional institutions, we also aren’t necessarily talking just about R2s. There are plenty of public institutions which don’t offer enough doctoral degrees to be so considered. But because they are public, 4-year undergraduate institutions, they get lumped together as being “regional.”

Defining the “regional university” (but this time in IPEDS)
I say all this to explain how I attempted to answer my question in the title. Instead of just looking at R2s, I looked at all public colleges with comprehensive, 4-year undergraduate curricula.
On IPEDS, you can create a list of institutions based on their Carnegie Classification. Using that tool, I excluded all private institutions, as well as any R1 “flagships,” special purpose schools (like public maritime academies), and community colleges.
This left me with a list of about 400 “regional” institutions. I then scanned the list and removed any state flagships which were not R1 institutions.
For example, the University of Wyoming is an R2. It’s also the only public, 4-year institution in the state, so it’s their flagship by default. I wanted to only examine institutions which were understood to be “regional” in the multiple applications of that term.
This left me with a list of 391 institutions.
Now then, are any of them growing?

Defining “growth”
IPEDS has lots of ways to describe enrollment. You can look at full-time or part-time students. Graduate or undergraduate or non-degree students. In-state, out-of-state, or international students. And you can even look at enrollment at different points in the year.
I decided to look at two measures Fall “total enrollment” and “full-time undergraduate enrollment.”
Typically, state funding to public institutions is based on their Fall semester headcount, so I focused on this count since it’s the one that is most important to public universities.
“Total enrollment” is exactly what it sounds like; it’s a count of every student enrolled at any level pursuing any outcome at that institution. Anyone who could be called “student” gets wrapped up in this number.
I also looked at “full-time undergraduate enrollment,” which is a slice of total enrollment only constituting undergraduates with a full course load. While growing in this population is not essential, per se, full-time undergraduates typically form the core of a university’s identity, culture, and tuition revenue. Institutions with big declines here can feel “hollowed out” and this is often the metric used to portend doom.
I then had to decide over what time scale I wanted to define growth. I used the most recent full reports on IPEDS, which are from 2022, for fall enrollment totals. I decided compare that with the 2012 reports to show ten years of enrollment change.
So, with those inputs, I could finally see some results.

Some results
Now that I had a big spreadsheet full of universities and their enrollments, I could calculate the percentage change in both measures.
Overall, out of 391 institutions, 98 saw growth in their undergraduate enrollment, and 112 saw growth in total enrollment.
At a basic level, that answers our question. Are any regional universities growing? Yes, about a quarter of them are.
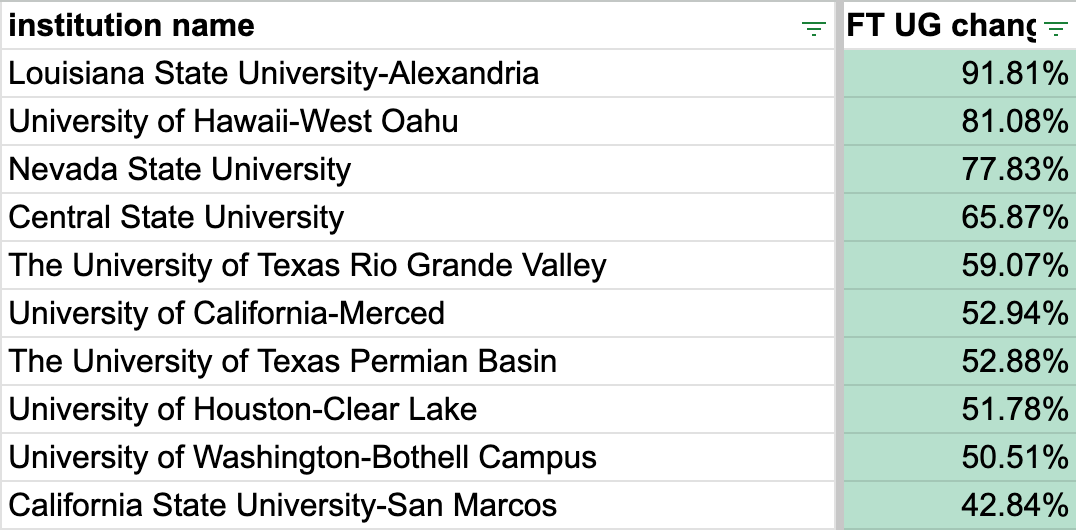
Here’s a snapshot of the top ten undergraduate enrollment growth leaders:
And now, the same thing for total enrollment growth:

While those universities may not be familiar to you (most of them are new to me too), you’ll see that there’s lots of overlap between lists. The institutions with the largest total growth often saw a lot of that growth through their undergraduate program.
I wanted to look at other ways of defining growth though.

In search of context
My concern with this simple counting approach was that it was susceptible to conflating factors. I want to try to resolve at least one of them: population change.
It’s possible that the universities which are growing are mostly growing because their state populations are growing. So I included the census information for each state from the two most recent census years to show the trend for population growth in the states which host each institution. Let’s look at the “total enrollment” top ten again.

All ten are in states with growing populations, though clearly some are growing faster than others. You can compare this with the bottom ten “total enrollment” institutions.

At a glance, it’s certainly yellower. The difference is not exactly definitive though.
If you look at the institutions in rapidly growing states (those in green), 57 of them have a growing total enrollment. That means about half of the institutions which saw total enrollment growth were in rapidly growing states.
Of course, there are 151 regional universities in rapidly growing states, meaning about two-thirds of them saw total enrollment declines despite their statewide population growth.
Now, I didn’t run a regression or anything, but in terms of face validity, that does not smell like significance to me.
More information is less information
The obvious explanation here is that regional universities are regional.
While every student in the state may benefit from in-state tuition at regional universities, they draw most of their students from nearby. If you’re interested in attending a regional university, you’re likely to attend one of those closest to you. So, statewide population growth may not mean much if the region around a given institution is not seeing that same kind of population increase.
Moreover, regional colleges often have agreements to offer in-state tuition to residents of neighboring counties across state lines. For example, the entire western edge of Ohio can attend IU-East as if they were Indiana residents.
Trying to normalize for state population growth can give you lots of new numbers. In fact, I tried to make several of them just to mess around.

Look at all those cool indicators that I tried to shade appropriately! They really look meaningful!
But what those indicators say is irrelevant because they can’t escape the “garbage in, garbage out” issue. I initially wanted to use statewide population information because it was easy to collect and compare. But if state population change is misleading, normalizing for it won’t help.
Collecting county-level population information might be more meaningful. But it would also be labor intensive and could result in even more errors. After all, how would I accurately determine which counties are the “region” for each institution?
Even if I got it right, population change is just one variable among many. Is it even the one I should be looking at?
This post is an example of running into a dead end. I built a very big spreadsheet with lots of numbers. But I don’t think it tells me as much those shaded cells imply.
I’m going to revisit this next week at a more micro level. I’ll see if I can learn anything by focusing on a few outlier institutions instead of trying to process this nation of regionals as a whole.
Until then!
-Matt