


Trying (and failing) to predict college closure
A flawed statistical inquiry

It is not a secret that higher education is nervous about its future. This is not a new phenomenon, and I wonder whether higher education has ever not been nervous about its future.
But the current concern is about the “enrollment cliff.” This refers to the fact that, starting in 2008, there was a rapid drop-off in the number of Americans being born without a concomitant recovery. Well, those 2008 babies are about to go to college, and lots of folks are concerned there won’t be enough of them to go around and keep all the existing higher education institutions afloat.
This fear of imminent institutional demise has been in the air for years. Whenever you have an uncertain future, people will look for any way to prognosticate and alleviate their concerns.
So, in a statistics course I took this semester, my group tried to do exactly that. I’d like to share a few things I learned from the process.

Terms of Engagement
It will be unsurprising that I decided to use IPEDS for this project. It’s easy to access and is great for building large data sets quickly. It tracks lots of financial indicators, among other things, and we could easily compare closed open colleges against one another.
We decided to see whether we could use single-year data from the 2022 financial reports (the most recent ones) to create a model that would predict whether colleges would close within two years or not. We used linear regression to make the prediction based on a sample of colleges which had and had not closed. The idea is to identify salient variable and then see whether the model can accurately predict an event you know to have transpired (in this case, “closure”).
I’ll be frank: we mostly decided to use single-year data for the sake of simplicity. But we also recognized that this question was well-trodden, so we wanted to try something novel. We also hoped to isolate COVID-related factors by only using information from 2022. In retrospect, this was not a great idea.
We ended up identifying 24 colleges which have ceased operations or been acquired since 2022. Specifically, we focused on private, non-profit colleges. I didn’t want to address the additional variable of considering public or for-profit institutions. Also, when people opine about the tragedy of the dying college, they’re usually talking about a small liberal arts college, not a technical school. Perhaps that’s wrongheaded, but for all their faults, non-profit colleges tend to capture the imagination and attention of people.
In order to have sufficient scale for the model to make valid guesses, we also identified 100 colleges which aren’t closed. There are about 1200 private, non-profit colleges offering bachelor’s degrees in the United States, but that’s more data than we needed. We decided to randomly select a sample of 100 institutions.
So with our group of 124 closed and open institutions, we needed to know how they should be compared. In focusing on financial drivers of closure risk, we decided to utilize the following:
Revenue from tuition per student (after financial aid and other discounts)
Revenue from private gifts per student
Endowment assets per student
Total enrollment
Religious affiliation
The first two variables basically say how much money colleges are earning on a “per student” basis (to control for scale). The third says how much money they have “in the bank.” Enrollment tells us whether there’s a “critical mass” of students for sustainable operation.
The last variable was one where we departed from the literature. We were curious whether there might be an effect where religiously affiliated college were less likely to close based on those sponsoring denominations “bailing them out.”
I bear no relation to these correlations
One important step in a process like this is looking for correlations between your selected variables. If an increase in one of them is significantly predictive of an increase in another, you generally shouldn’t use both.
We found that the only two variables with significant correlation were “total enrollment” and “endowment per student.” I’ll come back why that’s interesting to me later.
Despite this, we thought it would be weird to wholly exclude either of those two variables, ignoring either the size of the institution or the size of its bank account. So, we instead decided to create nested models.
This sounds more interesting than it is. It just means that we had one “simple” model which had four independent variables (excluding “endowment per student”) and one “complex” model which had all five. The models are “nested” because the simple model is wholly contained by the complex one. We can then examine whether the addition of “complexity” makes the model more or less predictive.
Nothing! Absolutely nothing!
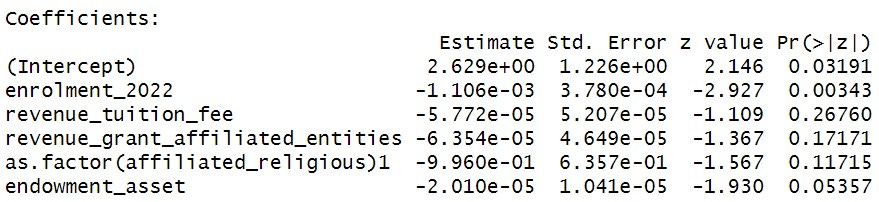
So, after running the analysis, we found something fun: we didn’t learn anything.
Some of the variables were significant, and some were not. But it didn’t really matter because all of them had an effect near zero. This gave our models, complex or otherwise, very little capacity to make informed predictions. When looking at the 24 colleges who did, in fact, close, the models only guessed about 25% of them would close based on their 2022 financial indicators. The two models performed very similarly, so the addition of “endowment per student” was kind of a wash.
I’ll admit, our homework problems usually didn’t result in a shrug emoji. So, what do you do with zero findings?
You get interested in your lack of findings
Despite learning nothing we intended to learn, we did learn some things we didn’t intended to learn.
For instance, we learned that ignoring trend data and focusing on single-year data inputs is probably just wrongheaded. After all, there are colleges who stay open with 10 graduates per year. There are colleges who close with nearly a thousand graduates.
There might be an upper limit which indicates a lack of closure risk, but I don’t think there’s a lower limit. The thing to look for with enrollment, to focus on one variable, is the trend. If you have fifty graduates because of a 200% decline in enrollment, then that tells you something different than having fifty graduates because you’ve always had fifty graduates.
I also want to come back to the fact that enrollment was highly correlated with endowment per student. Now, it’s obvious why enrollment would be correlated with “total endowment” because bigger institutions tend to have bigger bank accounts. But I was surprised to see that this was still true when you control for size, meaning bigger schools have bigger bank accounts on a “per student” basis too.
Perhaps naively, I assumed the opposite would be true. As a graduate of three liberal arts colleges, I imagined that liberal arts college alumni would be more generous in their giving toward the endowment funds because they have a more personal connection to their college. If you’re one of 500 graduates, your experience is very different than if you’re one of 10,000.
Anyway, that appears not to translate into reality. Maybe it’s that with more graduates, you’re more likely to strike gold with outlier donors who give at extreme rates. Indiana University only needs to graduate one guy named Mark Cuban to make a huge difference in its endowment.
Or maybe the fact of their larger endowment also leads to a larger per student endowment because the fund is handled more professionally. If it’s managed more like a hedge fund than a bank account, it could multiply its value as a product of its scale.
Anyway, I’m not really sure what’s going on, but at least this allows me to ask the question.
The last question is about religious affiliation. Although all our variables were meaningless, religious affiliation was actually less meaningless than the rest. That’s not what I would have guessed! Are there actually cases of denominations “bailing out” colleges in the modern day? Or is affiliation correlated with other latent factors which address closure risk?
This is basically a bigger question on examining how colleges relate to their affiliated denominations. I’m sure there’s a range of relations, but I have no real sense of what that range is.
Alright, well if you’d like to look at our mini-report or our source data, you’re welcome to do so. I hope you enjoyed hearing about my homework.
-Matt
I've wondered about this "enrollment cliff" too. It really needs to be looked at on a granular basis. Taking the national stats alone seems of less use. Great stuff though.